
Selected work / Visual decision tools
Compare the trade-offs. Keep the reasons.
Some choices become clearer when you can move through them. I build visual instruments that make mathematical relationships tangible, while keeping the decision in the hands of the person who understands what matters.
A ranking can hide the real choice
Choosing an AI model involves more than finding the highest benchmark score. Capability, cost and responsiveness pull in different directions. Collapsing them into one score requires a preference about those trade-offs, whether or not the interface makes that preference visible.
3D Pareto starts earlier. Given observations on three objectives, it identifies choices for which no other observed alternative is at least as good on all three objectives and better on at least one. These non-dominated choices form a set of real trade-offs worth examining; they do not tell everyone to choose the same thing.
The mathematics must survive the picture
I made the distinction between observed choices and visual geometry fundamental. A point in the dataset represents an observation. A line or face drawn between points is a way of seeing their relationship. It does not establish that an intermediate product exists, or that the attractive point nearest a visual ideal is the right recommendation.
For a simple synthetic example, imagine three alternatives measured in illustrative units. Quality should be higher; cost and response delay should be lower:
- A: quality 8, cost 3, delay 4.
- B: quality 7, cost 4, delay 5.
- C: quality 9, cost 5, delay 6.
A dominates B: it is better on all three measurements. A and C remain a genuine choice because C’s higher quality comes with greater cost and delay. The tool should make that relationship visible without inventing the value you place on the improvement. These numbers illustrate the concept; they are not model benchmark results.
From exploration to a retained decision
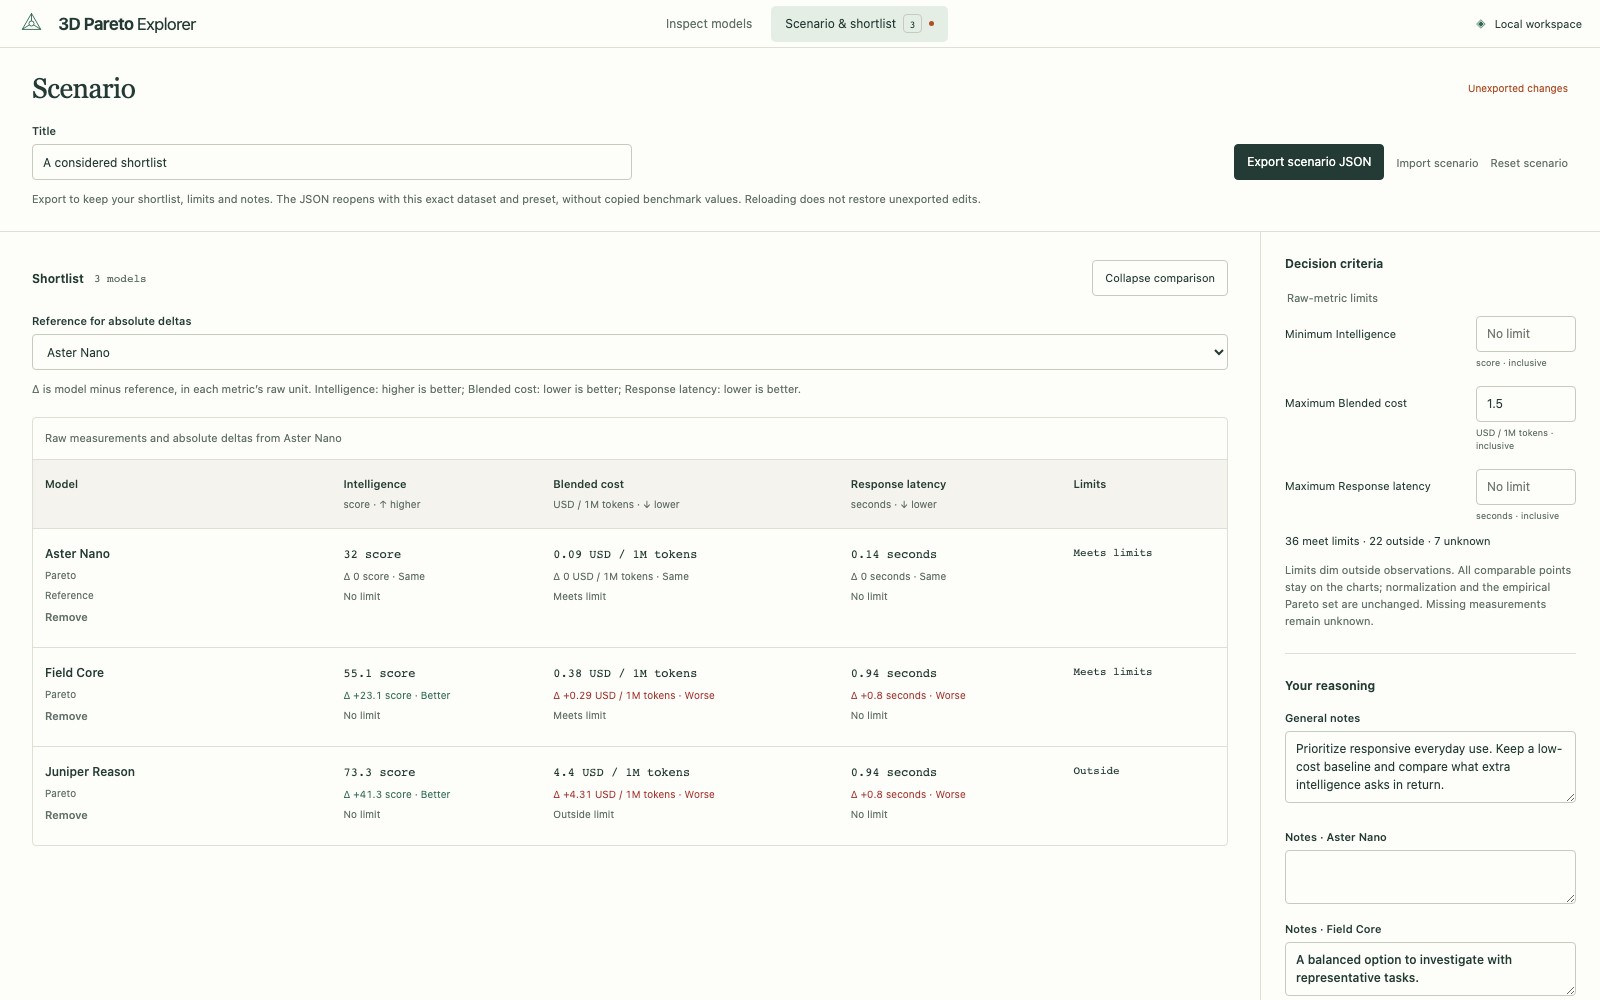
The product began with exploration, but a compelling plot was not enough. I extended the intended journey to include personal limits, comparison, a reasoned shortlist and a result the user can reopen.
You set thresholds in the original units, explore the linked three-dimensional and two-dimensional views, select alternatives and compare them against a reference. You can keep notes about the choice, including reasons that the three plotted metrics do not express. Missing measurements remain unknown rather than quietly becoming favourable values.
The shortlist and notes export to a local file bound to the exact dataset used. Reopening requires the compatible bundle. That deliberate constraint prevents an old decision from appearing to describe a changed set of measurements. There is no automatic save: retaining the exported file is part of the journey.
Interaction is part of the reasoning
I chose the rotating 3D view as the main instrument, with linked 2D plots and textual evidence alongside it. Rotation can reveal a relationship that is ambiguous in one projection; the simpler plots let a reader check it without relying entirely on spatial perception.
The local exploration, comparison and export path is implemented. Making depth and shape unambiguous during rotation remains a design focus. The benchmark dataset stays local under its redistribution terms; the public examples here use synthetic data.
Some instruments are simply for understanding
My double-pendulum study explores a different kind of mathematical relationship. It is an interactive simulation in a single HTML file, with live controls and a phase plot. The public source is available to inspect.
It does not need to become a commercial decision product. Both projects come from the same interest: use interaction to make an abstract relationship perceptible, then preserve enough of the underlying structure that the picture teaches rather than merely impresses.